|
 |
FB3 Group BKB Group BKB | 
|
|
 |

| 
|  |

|

|
Real World Graph Examples in uDraw(Graph)
It is most likely that
you are working with graphs every day,
even if you don't know them by this name.
A graph is a net-like structure.
Having a clear graph visualization - automatically generated
by uDraw(Graph) - is the precondition to understand
large structures easily.
Here we presents selected
applications of graph visualization
to demonstrate the substantial value of uDraw(Graph) for
various businesses.
|  |
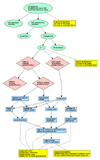
Project Management: Goal/Question/Metric Method (GQM)
|
 |  |
GQM
(more information)
is a popular approach for project management to
select metrics
in order to
analyse,
classify
and
predict
different
aspects in a development process.
At the top of a GQM graph is a
business goal
followed by
questions
on subsequent levels that can be answered by certain
metrics
at the bottom of the graph.
See this graph in full scale.
Download graph for uDraw(Graph).
|

|
|  |
Risk Evaluation: Fault Tree Analysis (FTA)
|
 |  |
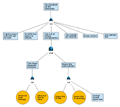
Fault tree analysis
(more information)
is
used in engineering
to evaluate and graphically represent interactions of
failures,
human errors
and other factors within a technical system.
A fault tree starts with a high-level event (error, risk, etc.),
followed by associated elements in the system that could cause
that top event to occur.
See graph in full scale.
Download graph for uDraw(Graph)
(for this graph, please save the icons
fta_and.gif
and
fta_or.gif
in the "icons" directory of your local uDraw(Graph) installation).
|

|
|  |
Corporate Planning: Business Goal Trees
|
 |  |
Business goal trees
(more information)
describe translations of primary goals
into sub-goals and metrics.
The abstract
primary goals
are broken down into more manageable
sub-goals,
until directly quantifiable goals are reached. After
having verified the consistency of the tree,
business operations are derived
from these bottom goals with the help of questions.
See this graph in full scale.
Download graph for uDraw(Graph).
|

|
|  |
Software Development: Control Flow Graphs
|
 |  |
To recognize the complex structure of a program,
software engineers are used to visualize
the program's control flow graph
(more information).
For simplification, the numbers in the
nodes of a control flow graph are usually
lines
(or marks)
in the source code
of the corresponding program.
The edges (connections) between the nodes represent all the
branches,
loops
and
jumps
in the program, or in other words the possible flow of control.
Of course, visualizing such graphs without an
automatic tool like uDraw(Graph)
is a cumbersome and expensive piece of work.
With a control flow graph, it is easy to calculate a metric in
order to compare the complexity of different programs, for
example cyclomatic complexity
(more information)
where the number of nodes and edges of a control flow graph
is considered.
See this graph in full scale.
Download graph for uDraw(Graph).
|
 |
 | 
|
|
 |


